
Institutional Research: Interactive Dashboards
Using Tableau Desktop, the Office of Institutional Research created the following data visualizations--interactive dashboards displaying trends and outcomes. They are intended to promote understanding of the characteristics of the College, to inform students’ academic choices and career exploration, and to support data-informed curricular discussions and institutional planning. We recommend you view these dashboards on your desktop or laptop, as they are not entirely mobile friendly at this point given the large amount of data.
Data Visualizations
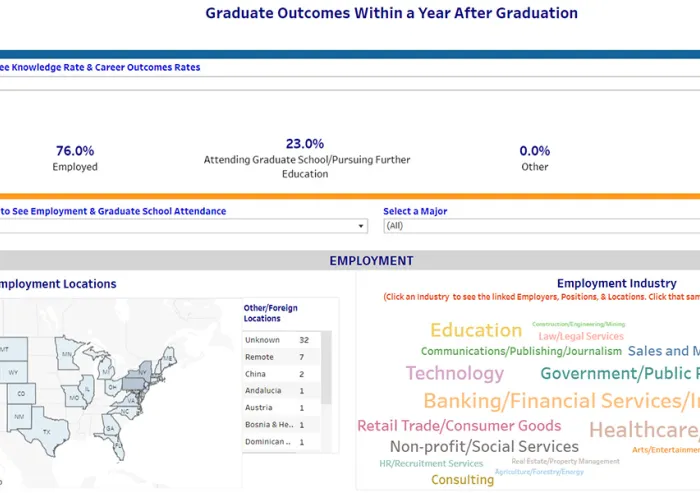
Post-Graduation Career Outcomes Within a Year After Graduation (First Destinations)
This Outcomes Dashboard displays career outcomes of students within 12 months of graduating from Gettysburg.
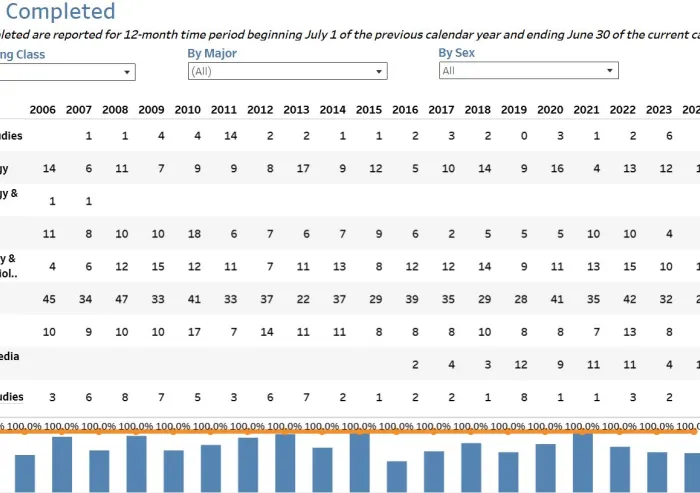
Degrees Awarded by Major and Sex (2007-2026)
The following interactive dashboard presents 20 years' completions data by Graduating Class, Major, and Sex (2007 - 2027).
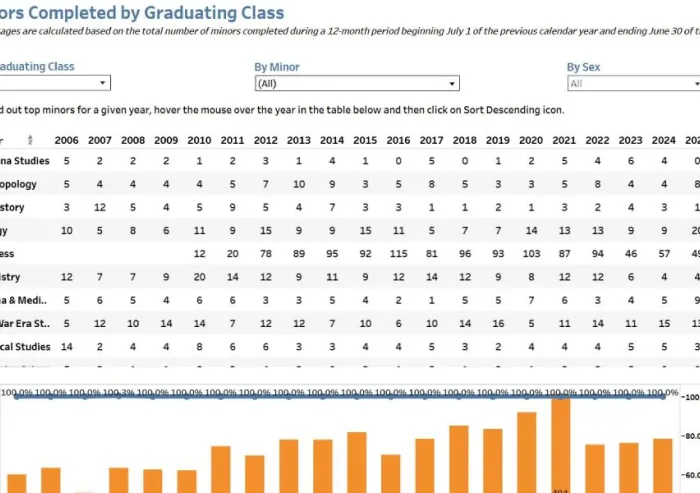
Minors Completed by Graduating Class and Sex (2007-2026)
The following interactive dashboard presents 20 years' data on minors completed by Graduating Class and Sex from 2007 to 2026.
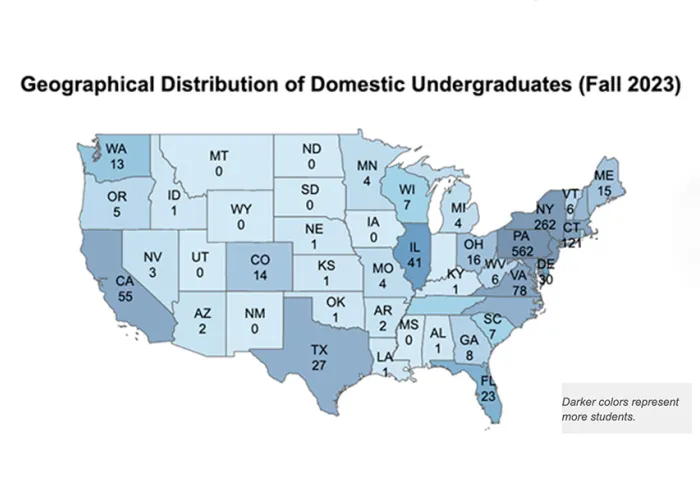
Geographical Distribution of Domestic Students
In Fall 2025, 16 percent of the degree-seeking undergraduate student body were international students, 24 percent were from Pennsylvania, and 59 percent were out-of-state students.